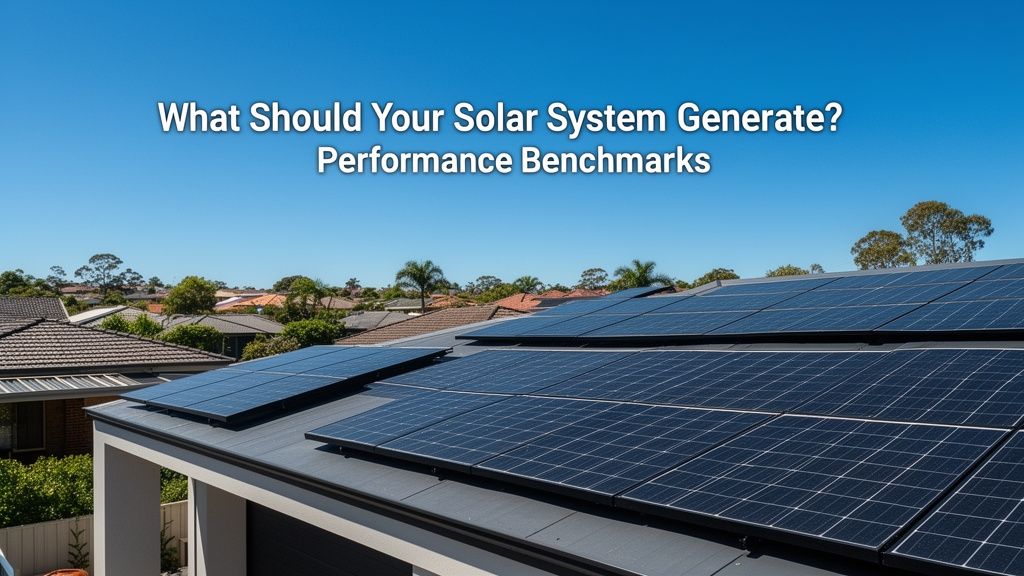
TL;DR: Your solar system's expected energy output depends on its size, location, and the weather. You can benchmark its performance by comparing its actual daily or monthly generation data against online calculators and historical averages for similar systems in your area. Regular monitoring helps identify and fix underperformance promptly.
What Factors Determine Your Solar System's Expected Output?
Your solar system’s expected output is a calculated figure based on several key variables, not just its size. Understanding these elements helps you set a realistic performance benchmark. A 6.6kW system, for example, might generate vastly different amounts of electricity depending on where it sits in Australia. System size, local sunlight hours, panel orientation, and potential shading all play a significant part in determining its daily and annual kilowatt-hour (kWh) production. This expected output is what you should use as your baseline for monitoring performance.
System Size and Panel Efficiency
The total DC capacity of your solar panels in kilowatts (kW) is the primary indicator of potential output. A standard residential 6.6kW system, often paired with a 5kW inverter due to Australian regulations, is common. Newer panels offer higher efficiency, meaning they convert more sunlight into electricity per square metre. For instance, panels with 21% efficiency will produce more power than 18% efficient panels of the same physical size. The quality of your inverter also influences performance; a premium inverter can maximise energy harvest, especially during less ideal conditions like cloudy days or high temperatures. A good quality 6.6kW system in Perth might generate 25-30 kWh on a clear summer day.
Local Climate and Orientation
Australia's diverse climate significantly impacts solar generation. A system in sunny Queensland or Western Australia will naturally produce more energy than one in Tasmania. Local weather patterns, including average daily sunshine hours, cloud cover, and even temperature, influence output. Solar panels perform less efficiently in extreme heat, losing a small percentage of power for every degree above 25°C. The angle and direction your panels face are also critical. North-facing panels generally receive the most direct sunlight in Australia, optimising generation. East-west configurations can still perform well, often by spreading generation across morning and afternoon peaks to match household usage patterns more effectively, though total daily output might be slightly lower than a purely north-facing array.
How Do You Calculate Your Solar Performance Benchmark?
Calculating your solar performance benchmark involves comparing your system's actual generation against a reliable estimate for similar conditions. This comparison allows you to gauge whether your system is working as it should, identifying any significant deviations from its expected output. Most solar monitoring apps provide daily and monthly production figures, which are essential for this calculation. Your initial system proposal likely included an estimated annual generation, often broken down by month, providing a good starting point.
Using Online Tools and Data
Several online tools can help you establish a baseline for your system's expected performance. The Clean Energy Council's Solar PV Calculator or even simpler tools like Sunulator can provide reasonable estimates based on your system size, location, and panel orientation. These tools use historical weather data and irradiance levels to predict typical daily or monthly output. For example, a 6.6kW system in Melbourne could expect to generate around 8,000-9,000 kWh annually, while the same system in Adelaide might hit 9,500-10,500 kWh. Your solar installer should also provide detailed generation estimates specific to your installation.
Comparing Actual vs. Expected Generation
Once you have an estimated benchmark, regularly compare it with your actual production data from your inverter or monitoring app. Check your daily kWh output against the estimated figures for that specific day or month. A difference of 5-10% is generally within an acceptable range, accounting for minor weather variations or dust. However, if your system consistently generates 20% or more below its benchmark, especially over several days or weeks with good weather, this signals a potential issue. Keep records of your generation for a few months to identify trends. Monitoring allows you to spot gradual declines in performance that might indicate a developing problem rather than just a one-off cloudy day.


What Does Underperformance Mean, and When Should You Act?
Underperformance means your solar system is producing significantly less electricity than its expected benchmark under similar weather conditions. This indicates that money is being lost through missed savings or reduced feed-in tariff credits. It is a sign that something is not right with your system and requires attention. Acting promptly when you notice consistent underperformance can prevent further energy losses and potential damage to components. Do not ignore a sustained drop in output, even if it seems minor at first.
Common Reasons for Lower Output
Several factors commonly lead to a solar system generating below its benchmark. Shading is a frequent culprit; a new tree, antenna, or even a build-up of dirt and bird droppings on a single panel can drastically reduce the output of an entire string of panels. Equipment faults, though less common with quality installations, can also occur, such as a failing inverter, optimiser, or damaged wiring. Degradation of panels over time is natural, but sudden drops are not. Grid issues, like voltage fluctuations, can also cause inverters to limit output or temporarily shut down. Dirty panels, especially after long dry periods, often reduce generation by 5-15%, making cleaning a simple first step.
Steps to Address Performance Issues
When you suspect underperformance, begin by checking your monitoring app for error messages or fault codes from your inverter. Sometimes a simple inverter reboot can resolve minor software glitches. Next, visually inspect your panels from the ground for obvious dirt, debris, or shading. If the issue persists, contact your original installer. They have the system's specifications and historical data, making diagnosis easier. They can check individual panel performance, inverter logs, and cabling. Most reputable installers offer warranty support and can arrange a service call. Do not attempt to climb onto your roof or tamper with electrical components yourself; always use a licensed and authorised solar electrician for safety and to maintain warranties.
Key Takeaways
- Your solar system's expected output depends on its size, location, orientation, and local weather conditions.
- Use online calculators and your installer's estimates to establish a monthly and annual performance benchmark for your system.
- Regularly compare your actual daily or monthly generation data from your inverter with your benchmark.
- A consistent drop of 20% or more below expected output warrants investigation.
- Common causes for underperformance include shading, dirty panels, and equipment faults.
- Contact your original installer or a licensed solar electrician if you suspect a performance issue.
Read More
For a comprehensive overview, check out our master guide: Read the Full Guide Here.